How to plot a point on the python graph
To draw a point on the graph with the python language, you can use the pyplot methods of the matplotlib module.
pyplot.plot(x,y)
pyplot.show()
The plot () method draws a point on the Cartesian diagram.
The show () method displays the graph.
A practical example
Import the pyplot module of matplotlib
>>> from matplotlib import pyplot as plt
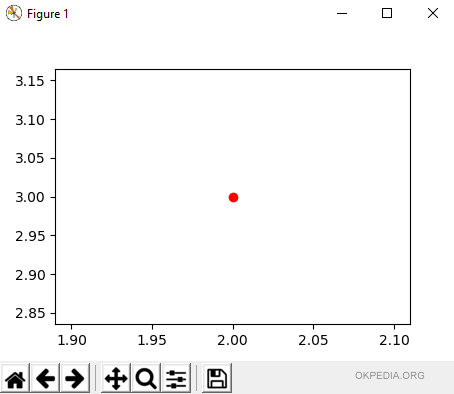
Draw a circular point (marker = "o") of red color (color = "red") on the Cartesian plane to the coordinates x, y (2,3) by plot() function.
>>> plt.plot(2,3, marker="o", color="red")
Display the graph on the screen by show() method.
>>> plt.show()
The graph is displayed on the screen. In the graph there is a red round point at the coordinates (2,3).

Types of markers
To change dot marker use the marker attribute.
There are different types of markers
| ch. | descrizione |
|---|---|
| '.' | point marker |
| ',' | pixel marker |
| 'o' | circle marker |
| 'v' | triangle_down marker |
| '^' | triangle_up marker |
| '<' | triangle_left marker |
| '>' | triangle_right marker |
| '1' | tri_down marker |
| '2' | tri_up marker |
| '3' | tri_left marker |
| '4' | tri_right marker |
| 's' | square marker |
| 'p' | pentagon marker |
| '*' | star marker |
| 'h' | hexagon1 marker |
| 'H' | hexagon2 marker |
| '+' | plus marker |
| 'x' | x marker |
| 'D' | diamond marker |
| 'd' | thin_diamond marker |
| '|' | vline marker |
| '_' | hline marker |
Types of colors
To change dot color use the color attribute.
The following colors are supported
| ch. | colore |
|---|---|
| 'b' | blue |
| 'g' | green |
| 'r' | red |
| 'c' | cyan |
| 'm' | magenta |
| 'y' | yellow |
| 'k' | black |
| 'w' | white |
It is possible to indicate a custom color using hex codes ('#00FF11').
- Can I change color to the point?
Yes, you can change the color of the point on the graph using the color attribute of the plot () method. - Can I change the shape of the dot?
Of course, you can use the marker attribute to indicate the shape of the point, round, square, triangular, etc. - Can I draw more points on the chart?
Yes, repeat the plot () function for each point several times or indicate a list of coordinates instead of the x and y values. - How many points can I draw on the chart?
There is no limit to the number of points you can draw on the screen with pyplot. - Can I combine the dots in a line?
Yes, you can do this by indicating the coordinates (x, y) of the initial and final point of the line in the plot method. The line between the two points is drawn on the graph. - Does the plot () command remain in memory after the graph is displayed?
No, the show method displays the graph on the screen and it clears data in memory.
