Comment faire un point sur le graphe python
Pour dessiner un point sur le graphique avec le langage python, vous pouvez utiliser les méthodes pyplot du module matplotlib.
pyplot.plot(x,y)
pyplot.show()
La méthode plot () dessine un point sur le diagramme cartésien.
La méthode show () affiche le graphique.
Un exemple pratique
Importer le module pyplot de matplotlib
>>> from matplotlib import pyplot as plt
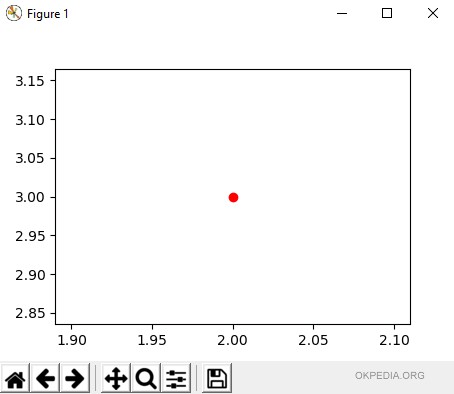
Tracer un point circulaire ( marker="o" ) de couleur rouge ( color="red") sur le plan cartésien aux coordonnées x, y (2,3) avec la fonction plot().
>>> plt.plot(2,3, marker="o", color="red")
Afficher le graphique à l'écran avec la fonction show().
>>> plt.show()
Le graphique montre un point rond rouge aux coordonnées cartésiennes (2,3).

Types de marqueurs
Pour définir le type de marqueur sur le graphique, utiliser l'attribut marker avec l'une des valeurs suivantes.
| ch. | descrizione |
|---|---|
| '.' | point marker |
| ',' | pixel marker |
| 'o' | circle marker |
| 'v' | triangle_down marker |
| '^' | triangle_up marker |
| '<' | triangle_left marker |
| '>' | triangle_right marker |
| '1' | tri_down marker |
| '2' | tri_up marker |
| '3' | tri_left marker |
| '4' | tri_right marker |
| 's' | square marker |
| 'p' | pentagon marker |
| '*' | star marker |
| 'h' | hexagon1 marker |
| 'H' | hexagon2 marker |
| '+' | plus marker |
| 'x' | x marker |
| 'D' | diamond marker |
| 'd' | thin_diamond marker |
| '|' | vline marker |
| '_' | hline marker |
Types de couleurs
Pour changer de couleur au point, utiliser l'attribut color avec le code de couleur.
| ch. | colore |
|---|---|
| 'b' | blue |
| 'g' | green |
| 'r' | red |
| 'c' | cyan |
| 'm' | magenta |
| 'y' | yellow |
| 'k' | black |
| 'w' | white |
Il est possible de choisir une couleur personnalisée en utilisant les codes hexadécimaux ('# 00FF11').
