How to make 2D graph in Matlab and Octave
To make 2D graph of a function in Matlab and Octave, use the function plot(x,y)
plot(x,y)
- The first parameter (x) is an array with the x axis values
- The second parameter (y) is an array with the y-axis values
The two arrays make up the coordinates (x, y) of the points of the graph on the Cartesian diagram.
Note.The two arrays x and y must have the same number of elements.
Examples
Example 1
Create an array with x-axis values
>> x = [ 1 2 3 4 5 ]
Create another array with y-axis values
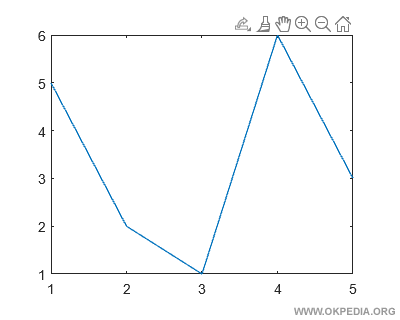
>> y = [ 5 2 1 6 3 ]
Both x and y arrays have five elements.
Draw the graph of the function using plot(x,y) command
>> plot(x,y)
This command draws the graph of the function on the screen.

Example 2
Create an array containing 100 elements
>> x = linspace(1,100);
Create another y array containing the natural log (x) values for each array x value.
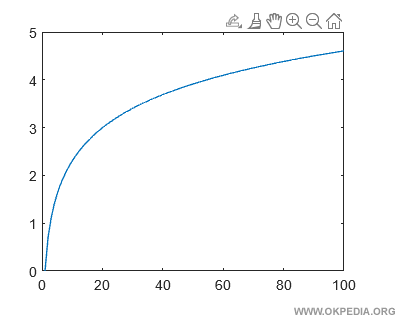
>> y = log(x);
Both x and y arrays have one hundred elements.
To draw the graph of the function, type plot(x,y)
>> plot(x,y)
This command draws the graph of the natural logarithm from 1 to 100.

